Picture credits
The charts and drawings are our own. The photos and portraits are public domain or CC0 on Wikimedia Commons, cropped and resized with no other changes.
Photos and portraits
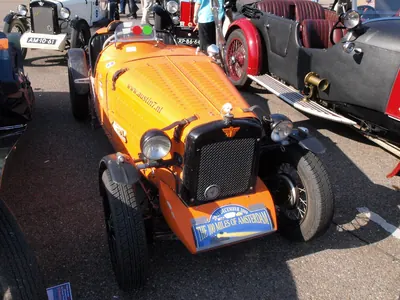
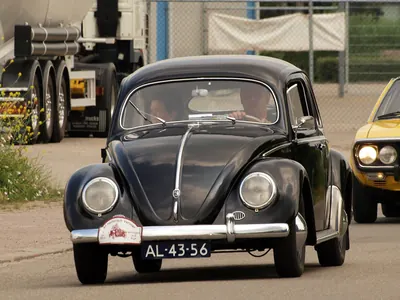
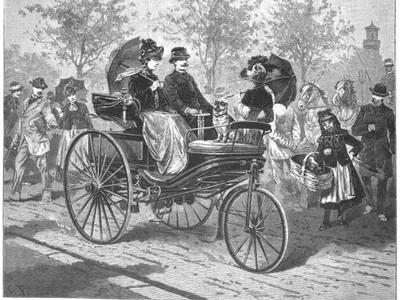
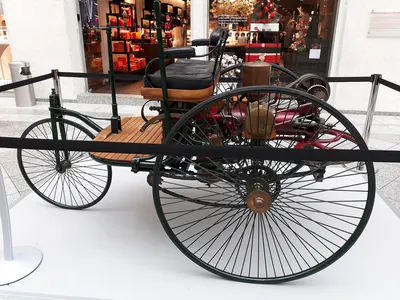
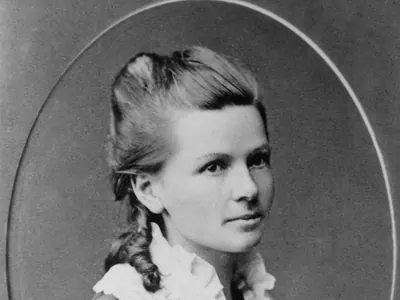
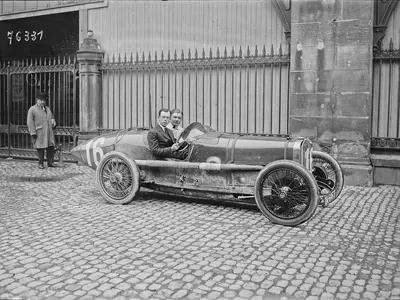
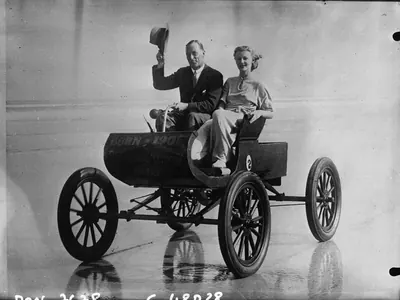 Sir Malcolm Campbell sur une voiture de 1901 sur la plage de Daytona 1933.jpg
by Mondial Photo-Presse, Public domain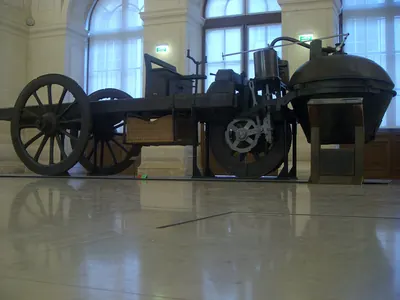
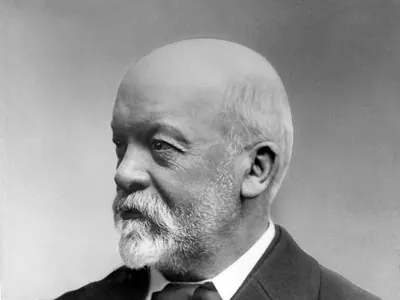
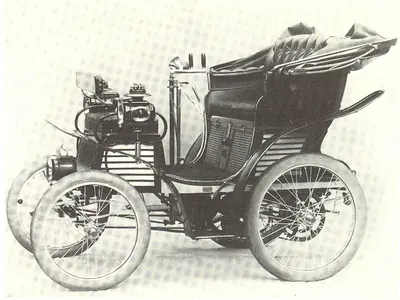
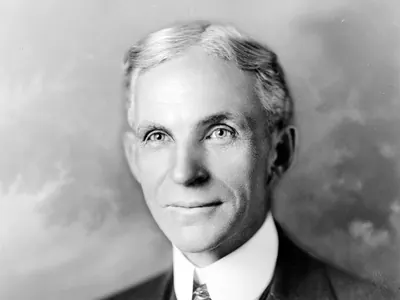
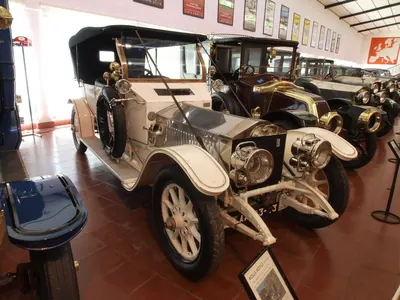
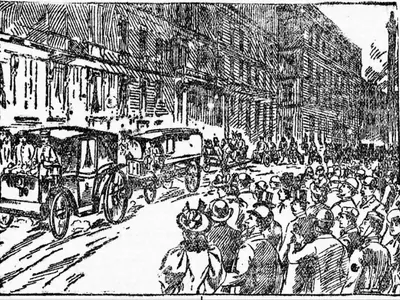
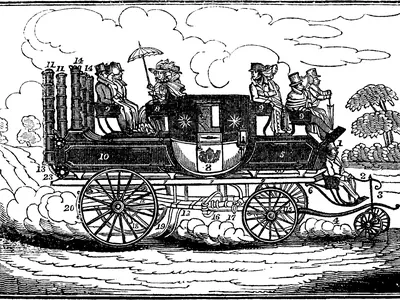 Goldsworthy Gurney steam carriage - Project Gutenberg eText 12496.png
by Unknown artist, via Project Gutenberg, Public domain
Our own charts and drawings
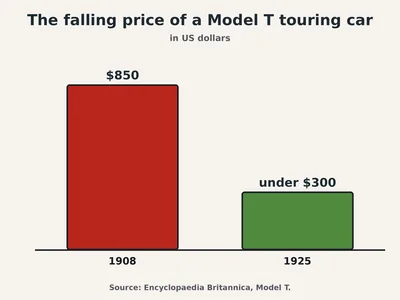 Bar chart: the Model T touring car cost 850 dollars in 1908 and less than 300 dollars in 1925
Our own drawing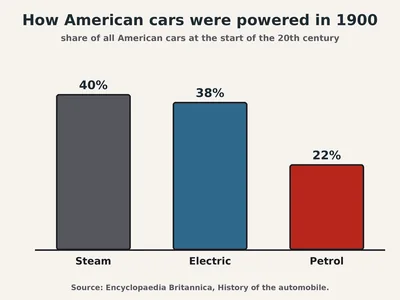 Bar chart: at the start of the 20th century 40% of American cars ran on steam, 38% on electricity and 22% on petrol
Our own drawing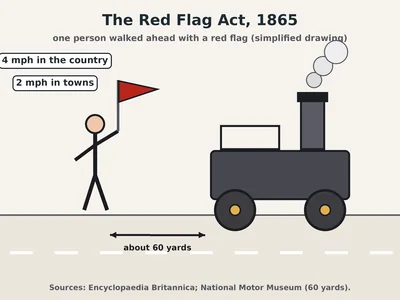 Simplified drawing of a steam carriage on a road with a person walking about 60 yards ahead carrying a red flag, with signs reading 4 mph in the country and 2 mph in towns
Our own drawing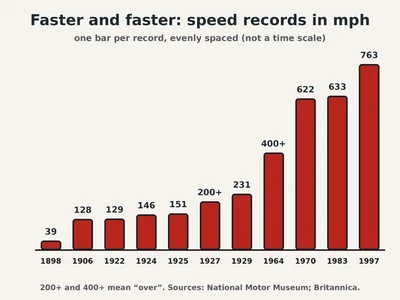 Bar chart of eleven speed records in miles per hour: 39 in 1898, 128 in 1906, 129 in 1922, 146 in 1924, 151 in 1925, over 200 in 1927, 231 in 1929, over 400 in 1964, 622 in 1970, 633 in 1983 and 763 in 1997
Our own drawing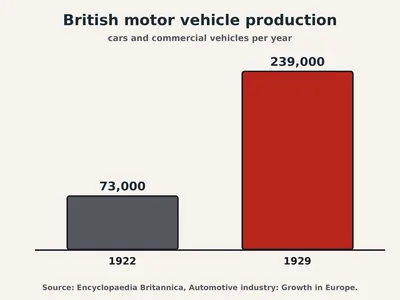 Bar chart: British motor vehicle production rose from 73,000 in 1922 to 239,000 in 1929
Our own drawing
The Red Flag drawing is a simplified teaching drawing, not to scale. The charts are drawn by our own code from the sourced figures on this site. Speed Through Time and the games are our own code. Useless the eraser is the network’s own mascot. Fonts: Bricolage Grotesque, Newsreader and Kalam (SIL Open Font Licence), served from this site.